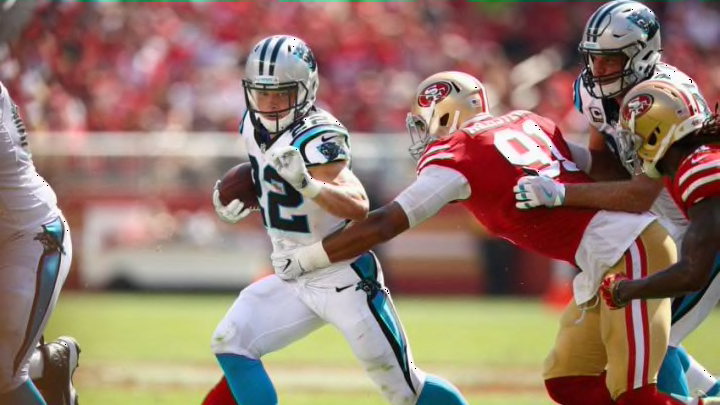
Panthers vs. 49ers: Full Week 8 preview, breakdown for San Francisco

49ers vs. Panthers: Week 8 by the numbers
Offensively, the Panthers and the 49ers have had some similar numbers across the board. The Panthers do have a slight edge over the 49ers in this area, but it’s important to factor in San Francisco played in horrible conditions last week in Washington against the Redskins, which was not very good for offense.
Offensive Breakdown
| Tot | Tot | Pass | Pass | Pass | Pass | Pass | Rush | Rush | Rush | Rush | |||||
|---|---|---|---|---|---|---|---|---|---|---|---|---|---|---|---|
| Rk | Tm | G | PF | Yds | Y/P | TO | Cmp | Att | Yds | TD | Int | Att | Yds | TD | Y/A |
| 12 | Carolina Panthers | 6 | 166 | 2118 | 5.5 | 9 | 130 | 212 | 1341 | 7 | 1 | 157 | 777 | 10 | 4.9 |
| 15 | San Francisco 49ers | 6 | 156 | 2323 | 5.7 | 11 | 115 | 168 | 1287 | 7 | 6 | 234 | 1036 | 8 | 4.4 |
| Avg Team | 149.1 | 2326.6 | 5.6 | 9.6 | 148.8 | 230.3 | 1592.8 | 10.0 | 5.4 | 172.3 | 733.8 | 5.9 | 4.3 |
Provided by Pro-Football-Reference.com: View Original Table
Generated 10/25/2019.
Despite the poor conditions last week, the 49ers have only scored 10 fewer points and still average more yards per offensive play.
Kyle Allen is perfect so far in his four starts throwing seven touchdowns and no interceptions (Carolina’s lone interception was not thrown by him), while Jimmy Garoppolo, of course, is responsible for all of the 49ers passing stats.
Running wise, the Panthers enjoy more yards per attempt. But the Niners focal running-back-by-committee approach to the offense has netted significantly more yardage.
| Tot | Tot | Pass | Pass | Pass | Pass | Pass | Rush | Rush | Rush | Rush | |||||
|---|---|---|---|---|---|---|---|---|---|---|---|---|---|---|---|
| Rk | Tm | G | PF | Yds | Y/P | TO | Cmp | Att | Yds | TD | Int | Att | Yds | TD | Y/A |
| 2 | San Francisco 49ers | 6 | 64 | 1341 | 4.2 | 13 | 91 | 165 | 801 | 5 | 7 | 133 | 540 | 1 | 4.1 |
| 9 | Carolina Panthers | 6 | 133 | 2064 | 4.9 | 15 | 146 | 239 | 1350 | 7 | 9 | 152 | 714 | 7 | 4.7 |
| Avg Team | 149.1 | 2326.6 | 5.6 | 9.6 | 148.8 | 230.3 | 1592.8 | 10.0 | 5.4 | 172.3 | 733.8 | 5.9 | 4.3 |
Provided by Pro-Football-Reference.com: View Original Table
Generated 10/25/2019.
The 49ers have been lauded for their defense, but Carolina boasts a top defense that’s more than capable of getting the ball (their 15 takeaways actually top the 13 of San Francisco).
San Francisco have the edge on overall yardage and points conceded however, which is why the defense is ranked second in the NFL.
The Panthers enjoy the advantage on offense, but the defense still swings around to the advantage of San Francisco.