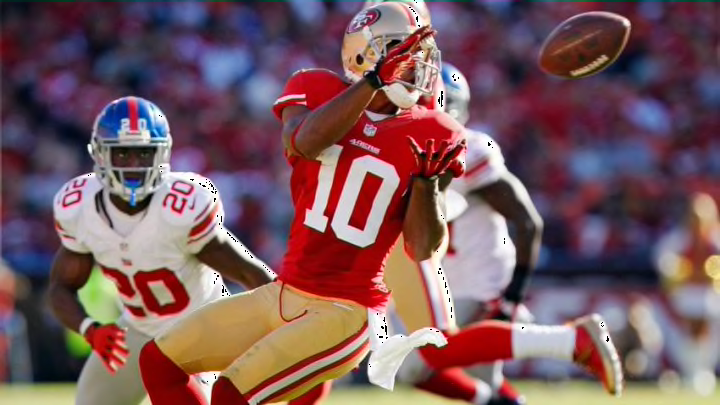
Giants vs. 49ers: Full San Francisco preview for Week 10
By Peter Panacy

Week 10 by the Numbers
With a combined one win between the 49ers and Giants, it’s safe to say neither team has done well, statistically.
The five-game stretch earlier this season, where the Niners were losing by three points or less, is long since over. While some could have looked at that as an indication head coach Kyle Shanahan’s squad was close, the past three games have seen his offense score a mere 10 points per game.
And all of that has led to some pretty woeful offensive numbers, but the Giants are in the same boat.
Offensive Statistics
Take a look at the offensive numbers the 49ers have put up this season and where this unit ranks in comparison to the rest of the NFL:
| Tot | Pass | Pass | Pass | Rush | Rush | Rush | Rush | |||||
|---|---|---|---|---|---|---|---|---|---|---|---|---|
| Player | PF | Yds | TO | FL | 1stD | Yds | TD | Int | Att | Yds | TD | Y/A |
| Team Stats | 143 | 2785 | 14 | 6 | 167 | 1956 | 6 | 8 | 199 | 829 | 7 | 4.2 |
| Lg Rank Offense | 30 | 24 | 21 | 25 | 21 | 18 | 32 | 21 | 29 | 24 | 11 | 13 |
Provided by Pro-Football-Reference.com: View Original Table
Generated 11/9/2017.
While bad, the Giants aren’t having much better luck:
| Tot | Pass | Pass | Pass | Pass | Rush | Rush | Rush | Rush | |||||
|---|---|---|---|---|---|---|---|---|---|---|---|---|---|
| Player | PF | Yds | TO | FL | 1stD | Yds | TD | Int | NY/A | Att | Yds | TD | Y/A |
| Team Stats | 129 | 2394 | 10 | 4 | 133 | 1700 | 12 | 6 | 5.4 | 175 | 694 | 2 | 4.0 |
| Lg Rank Offense | 28 | 28 | 13 | 10 | 30 | 20 | 15 | 13 | 26 | 30 | 27 | 29 | 20 |
Provided by Pro-Football-Reference.com: View Original Table
Generated 11/9/2017.
It’s possible to place some of the blame on the lack of offensive weapons both teams have right now, especially the bad quarterbacking the 49ers have had. Yet it isn’t as if either team is dominating the defensive side of the ball either.
Defensive Statistics
Heading into this contest, the Niners have allowed the second most points in the NFL (239) and are giving up an average of 5.4 yards per play, which is tied for 10th.
This, combined with the 27th-ranked yardage defense, certainly points to San Francisco being on the field a lot. And we can blame offensive inability there, as well as a lack of defensive playmakers.
But the Giants actually rank worse in average yards per play allowed (5.8). And while they haven’t given up as many points on the season (207), one could argue the Niners have a slight advantage here.
Especially considering New York ranks 31st in average offensive duration (2:21).