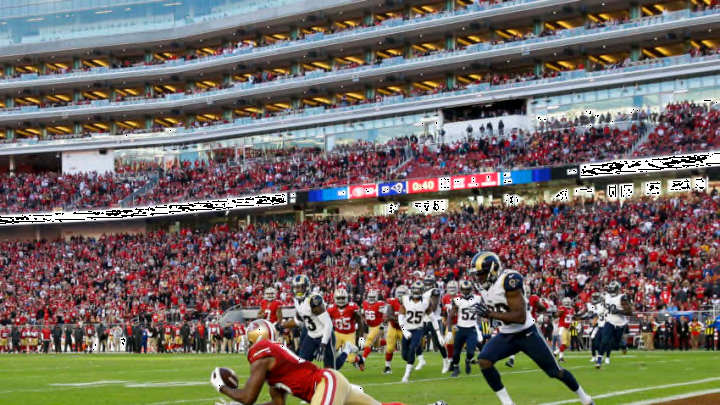
Quarterback Brian Hoyer’s Red-Zone Effectiveness
If we were to look at statistics alone, quarterback Brian Hoyer would be at his best within the red zone.
In fact, one might argue it’s his best area on the field. Just check out the splits:
| Pass | Pass | Pass | Pass | Pass | Pass | Pass | Pass | Pass | Pass | Pass | Pass | ||
|---|---|---|---|---|---|---|---|---|---|---|---|---|---|
| Split | Value | Cmp | Att | Inc | Cmp% | Yds | TD | 1D | Int | Rate | Sk | Y/A | AY/A |
| Field Position | Own 1-10 | 25 | 42 | 17 | 59.52 | 303 | 0 | 12 | 2 | 61.9 | 0 | 7.2 | 5.07 |
| Own 1-20 | 112 | 183 | 71 | 61.20 | 1532 | 1 | 62 | 8 | 71.6 | 9 | 8.4 | 6.51 | |
| Own 21-50 | 319 | 504 | 185 | 63.29 | 4073 | 1 | 205 | 10 | 80.9 | 30 | 8.1 | 7.23 | |
| Opp 49-20 | 212 | 379 | 167 | 55.94 | 2537 | 11 | 122 | 6 | 79.7 | 20 | 6.7 | 6.56 | |
| Red Zone | 71 | 134 | 63 | 52.99 | 469 | 31 | 41 | 2 | 94.2 | 6 | 3.5 | 7.46 |
Provided by Pro-Football-Reference.com: View Original Table
Generated 7/10/2017.
Out of 44 career touchdowns thrown, 31 of these have come within the red zone. And against just two interceptions. Even better, Hoyer owns a 94.2 passer rating within opponents’ 20-yard lines — another hopeful indication for 2017.
But there’s a downside.
Remember, those touchdown scores spike a passer rating. And the 52.99 completion percentage — lower than any other area — is a bit of a worry.
This, from Niner Noise’s Rich Madrid, might explain it:
Every time a QB does this, it allows the defender that extra 2 tenths of a second they need to disrupt the play. pic.twitter.com/PFFLJRkyTu
— Rich (@richjmadrid) July 8, 2017
Madrid is showing the slight ball pat Hoyer makes before each pass attempt. In some cases, Hoyer might be able to get away with this over an elongated field where the converging distances are greater.
But in the red zone, this split-second habit can be the difference between an open receiver in the end zone and a deflected pass or interception.
It’s not something Hoyer can get away with often, especially when the field is so small and the room with which to work is so tiny.
