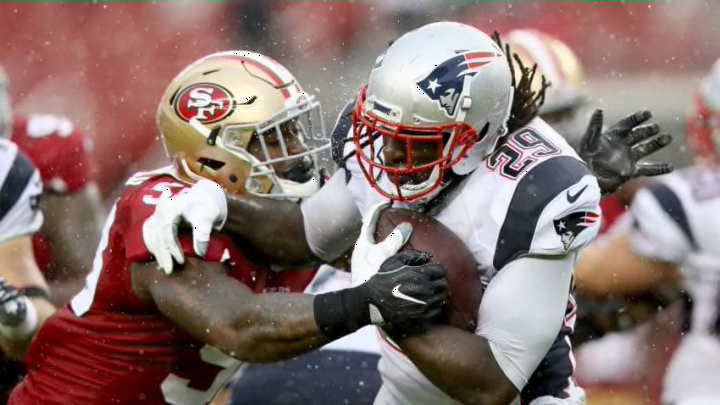
Crazy stats between 49ers, Patriots top-ranked defenses in 2019
By Peter Panacy

The New England Patriots and San Francisco 49ers own the Nos. 1 and 2 overall defenses in 2019, respectively, and the comparisons between the two are quite insane.
If you subscribe to the idea “defenses win championships” and think the San Francisco 49ers and New England Patriots are on a collision course for Super Bowl LIV, this is the statistical breakdown piece for you.
While there are many reasons why both the Niners and Pats remain undefeated through eight weeks, both teams’ defenses have shone by far above the rest, easily staking claims as the best defensive units in the league at the halfway point of 2019.
The Patriots, having played one more game than San Francisco, have allowed just 61 points on the season, which makes them owners of the No. 1 scoring defense so far. With 77 points allowed, the 49ers come in easily at No. 2.
Even crazier, the Niners have allowed a total of 23 points combined over their last four games. The Patriots have given up 34 over their last four games, and both teams have pitched a shutout during this same span.
There are an awful lot of similarities between both New England and San Francisco’s defensive stats and rankings entering Week 9, too:
| Tot | Tot | Pass | Pass | Pass | Pass | Pass | Pass | Rush | Rush | Rush | Rush | ||||
|---|---|---|---|---|---|---|---|---|---|---|---|---|---|---|---|
| Player | PF | Yds | Y/P | TO | 1stD | Cmp | Att | Yds | TD | Int | NY/A | Att | Yds | TD | Y/A |
| Opp. Stats | 61 | 1872 | 4.1 | 25 | 103 | 143 | 273 | 1190 | 2 | 19 | 3.9 | 148 | 682 | 2 | 4.6 |
| Lg Rank Defense | 1 | 2 | 1 | 2 | 11 | 2 | 1 | 1 | 1 | 1 | 4 | 2 | 21 |
Provided by Pro-Football-Reference.com: View Original Table
Generated 10/28/2019.
| Tot | Tot | Pass | Pass | Pass | Pass | Pass | Pass | Rush | Rush | Rush | Rush | ||||
|---|---|---|---|---|---|---|---|---|---|---|---|---|---|---|---|
| Player | PF | Yds | Y/P | TO | 1stD | Cmp | Att | Yds | TD | Int | NY/A | Att | Yds | TD | Y/A |
| Opp. Stats | 77 | 1571 | 4.1 | 16 | 87 | 110 | 202 | 901 | 5 | 10 | 3.9 | 152 | 670 | 2 | 4.4 |
| Lg Rank Defense | 2 | 1 | 3 | 1 | 3 | 1 | 2 | 2 | 2 | 6 | 11 | 3 | 20 |
Provided by Pro-Football-Reference.com: View Original Table
Generated 10/28/2019.
It shouldn’t come as a shock the Patriots boast the No. 1 scoring differential in the NFL through eight weeks (plus-23.6), while the Niners aren’t far behind at No. 2 (plus-18.6).
There are so many other similar comparisons, too. The Pats lead the NFL with 31 sacks, while the 49ers have 27 with one fewer game played. San Francisco, meanwhile, owns the league’s best pressure percentage (29.7), while New England ranks fourth in this category (27.0).
Still not convinced how similar these two defenses are, statistically?
One can make an argument wins and losses hinge largely on the ability to convert, or prevent third-down conversions, while red-zone touchdown efficiency is just as important.
Not surprisingly, both the Niners and Pats rank within the third best in each category:
- Opponents’ third-down success rate
- No. 1: Patriots (15.6 percent)
- No. 2: Cowboys (26.3 percent)
- No. 3: 49ers (27.7 percent)
- Opponents’ red-zone touchdown efficiency
- No. 1: Patriots (14.3 percent)
- No. 2: 49ers (23.1 percent)
- No. 3: Broncos (40.9 percent)
As shown, no other defense is holding its opposition to third-down conversion percentages lower than 30 percent. And San Francisco and New England are the only two teams with red-zone defenses preventing touchdowns fewer than a quarter of stands within this area.
One could argue the Patriots have enjoyed an easier schedule than their 49ers counterparts. After all, the only team above .500 the Pats have played are the 5-2 Buffalo Bills, while the Niners have played two such teams, the Los Angeles Rams (5-3) and Carolina Panthers (4-3).
Next. Top 5 takeaways from 49ers' Week 8 win vs. Panthers. dark
Still, both New England and San Francisco are dominating on the defensive side of the ball, which could be the elements propelling both into a potential Super Bowl showdown at the end of the season.