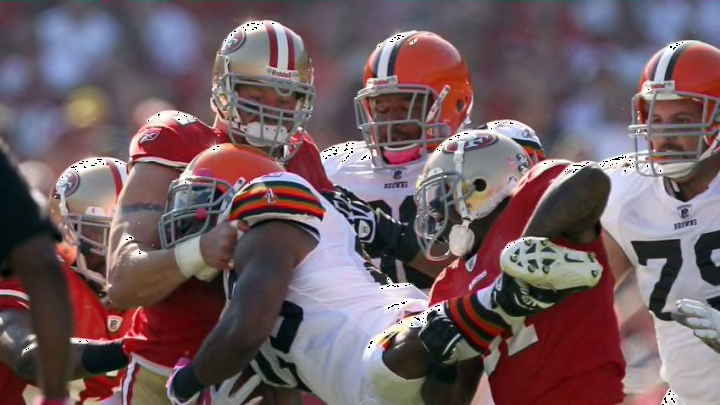
Week 5 by the Numbers
A quarter of the season is typically needed to determine how any given team is coming together, offensively and defensively. And while San Francisco has played one less game than 30 other squads across the NFL, thanks to the bye week, the early results for Kyle Shanahan and Co. have been resoundingly positive.
Offense
- Scoring offense: 32 points per game (third)
- Moving the ball: 421 yards per game (fourth)
- 4.6 rush yards per play (12th)
- 8.5 pass yards per play (third)
Defense
- Scoring defense: 18 points allowed per game (eighth)
- Giving up yardage: 283.3 yards allowed per game (third)
- 3.4 rush yards allowed per play (third)
- 5.5 pass yards allowed per play (seventh)
Offensive turnovers have been a problem for the 49ers, of course, as the Niners are losing these on an average of 2.7 per game, which is the worst margin in the league. Yet those numbers are inflated by the five-turnover contest in Week 3, in which San Francisco still managed to beat the one-win Pittsburgh Steelers anyway.
As for Cleveland, things get right into the middle of the pack.
Offense
- Scoring offense: 22.3 points per game (15th)
- Moving the ball: 380.3 yards per game (13th)
- 4.9 rush yards per play (ninth)
- 7.0 pass yards per play (10th)
Defense
- Scoring defense: 22.7 points allowed per game (14th)
- Giving up yardage: 335 yards allowed per game (11th)
- 4.6 rush yards allowed per play (21st)
- 6.1 pass yards allowed per play (10th)
The Browns have done a much better job protecting the ball, losing turnovers just six times this season. But all of those have come from the hand of quarterback Baker Mayfield, who is tied for second in the NFL lead for interceptions thrown with six.
Speaking of quarterbacks…
